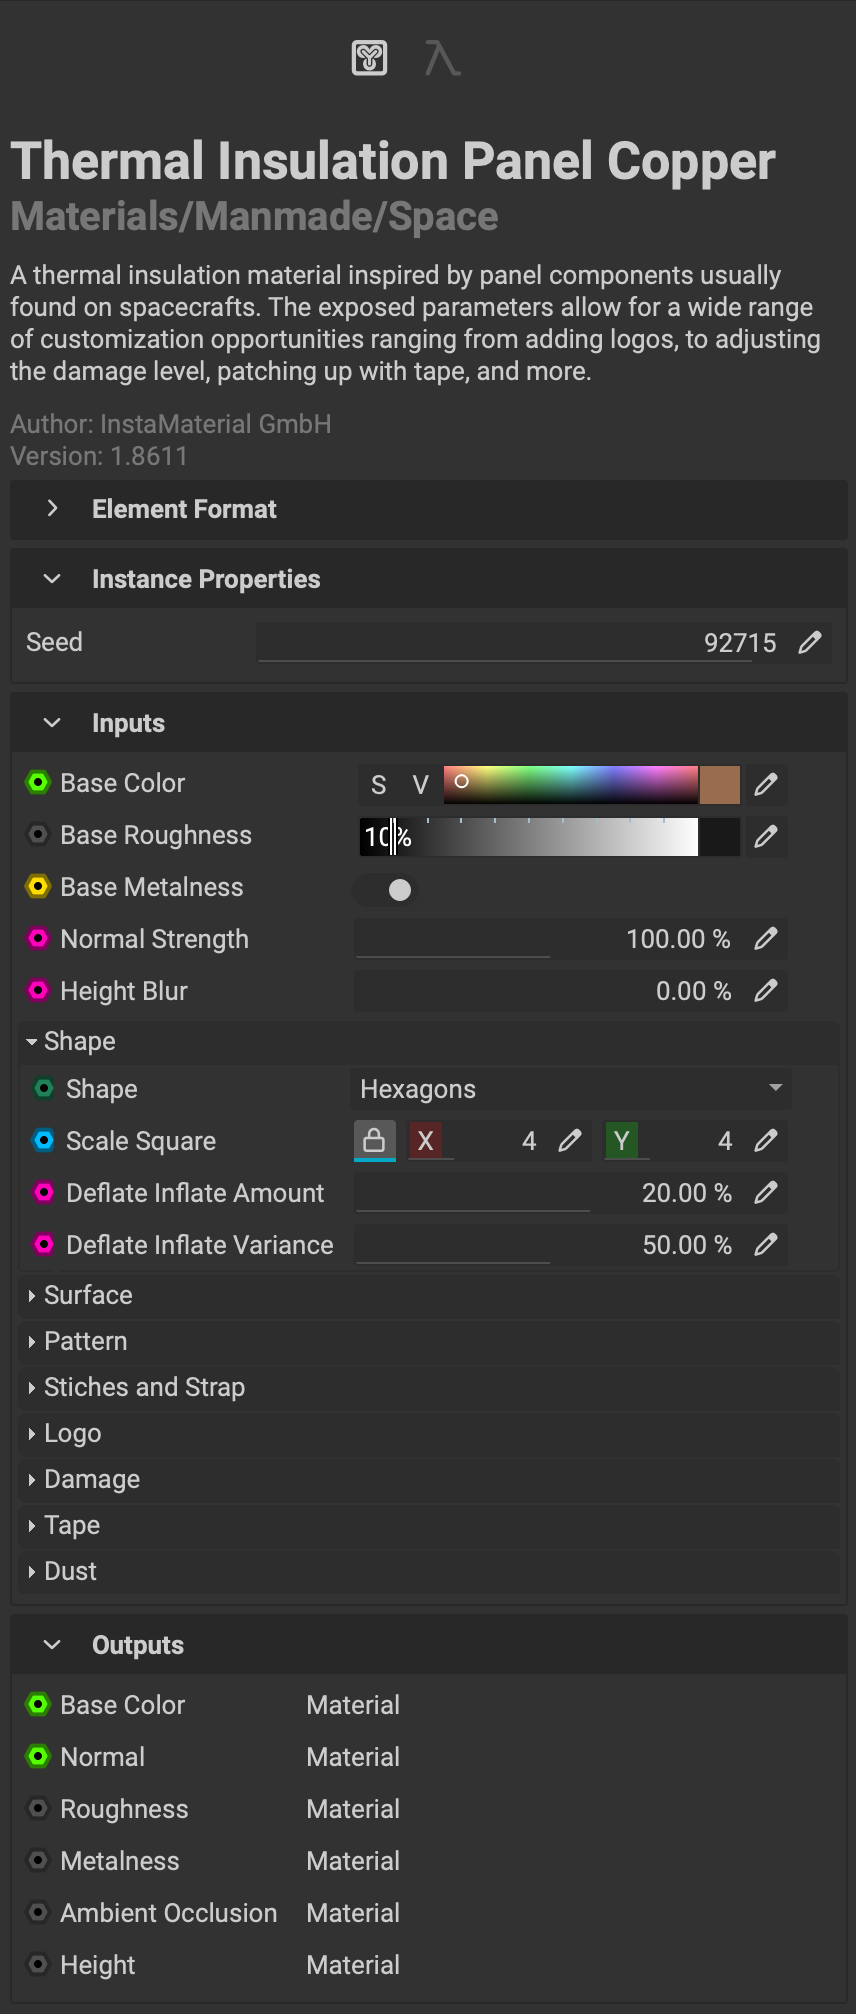
The Graph Object Editor (GOE) panel provides contextual access to a selected object's properties. From here, various operations such as the creation of inputs and outputs, the adjustment of a node's exposed parameters, and the assignment of various meta data to a graph can be performed. Much of the majority of the interaction within the Canvas involves selecting a node and making adjustments to its properties with this panel.
The GOE's UI and categories adjust based on the type of object selected. Selecting a node will display the properties of that node such as its Element Format settings, Instance Properties, Inputs, and Outputs. Clicking on the Canvas view in a blank area will display the properties of the currently active graph. In addition to the graph's inputs and outputs, its Local Variables, Versioning, and the graph's Meta Data settings are also found in the GOE.
This article breaks down the interface of the Graph Object Editor based on the type of object selected.
¶ Node
When a node is selected, the Graph Object Editor displays the following information.
¶ Information
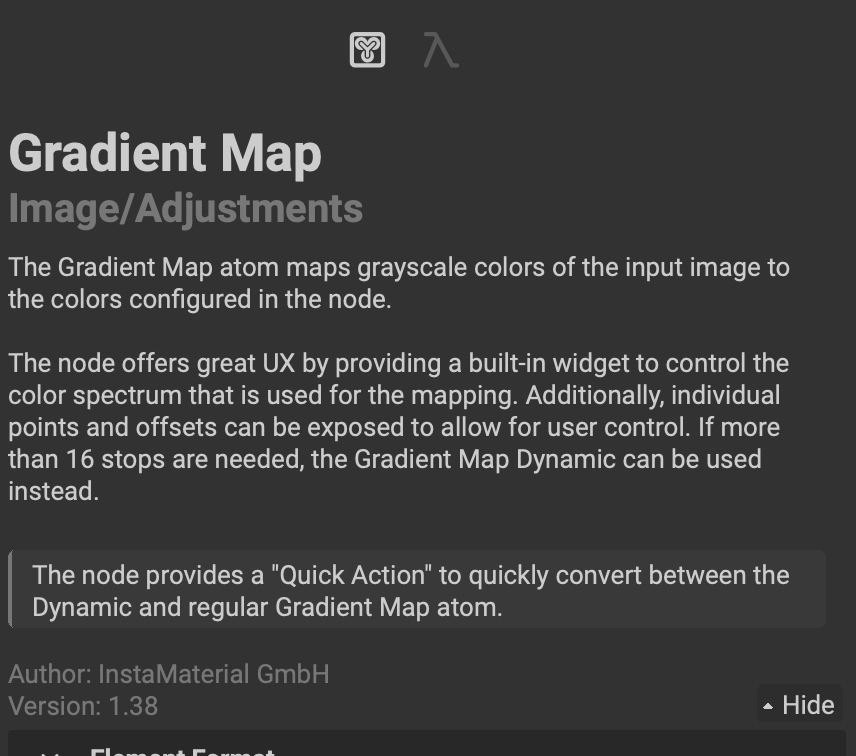 This section displays the common node information.
The following node attributes are listed:
- Name
- Category
- Description
- Author
- Version Number
¶ Element Format
 This section determines the node's format and execution size.
- Format Type: The method in which the node will be executed. The format can be set to the following options
- Normalized8, Normalized16, FullRange16, FullRange32: This will manually set the format regardless of any parent graph inheritance or connected node inputs.
- Inherit: The format will be inherited from the parent graph.
- DeriveFromFirstAvailableImageInput: The format will be set based on the node connected to the first available 'Image' type graph input.
- InheritFormatDeriveSizeFromFirstAvailableImageInput: The format will be inherited from the parent graph and the size will be set based on the node connected to the first available 'Image' type graph input.
- Width and Height: The size at which the node will be executed.
- Absolute Size: If enabled, the node's size will be determined by a specific resolution instead of a relative size.
¶ Relative and Absolute Execution Size
There are two methods to determine a node's execution size: relative and absolute. The method is chosen based on the status of the Absolute Size switch.
| Absolute Size Switch | Method |
|---|---|
| Enabled | Absolute: The node will be executed at a constant size such as '1024' x '1024'. |
| Disabled | Relative: The node will either Inherit the size if selected, or be executed at a relative size to the parent graph such as /2 or *4. |
¶ Instance Properties
 This section determines the execution seed, if a node is active or disabled, and toggles the node's grayscale/color permutation resulting in the node outputting grayscale or color data.
- Seed: The execution seed for the node. All parameters and internal nodes that supply variation derive their random attributes from this seed. For example: If the selected node is a material, changing the seed will result in a new variation of that material. If the node is a noise, changing the seed will result in a variation of that noise.
- Active: Sets whether the node is active or disabled. Disabled nodes display a icon in the top left corner next to their name in the
Canvasview. Nodes that have aBackgroundorImageinput will pass that information through to the output.
A shortcut for disabling nodes is highlighting the node and pressing H. You can also right click the node to bring up the contextual menu and choose
Enable/Disable Node. To learn more about disabling nodes, check out our dedicated video on our YouTube channel.
- Grayscale: Determines the grayscale/color permutation of the node. Enabling will output grayscale information.
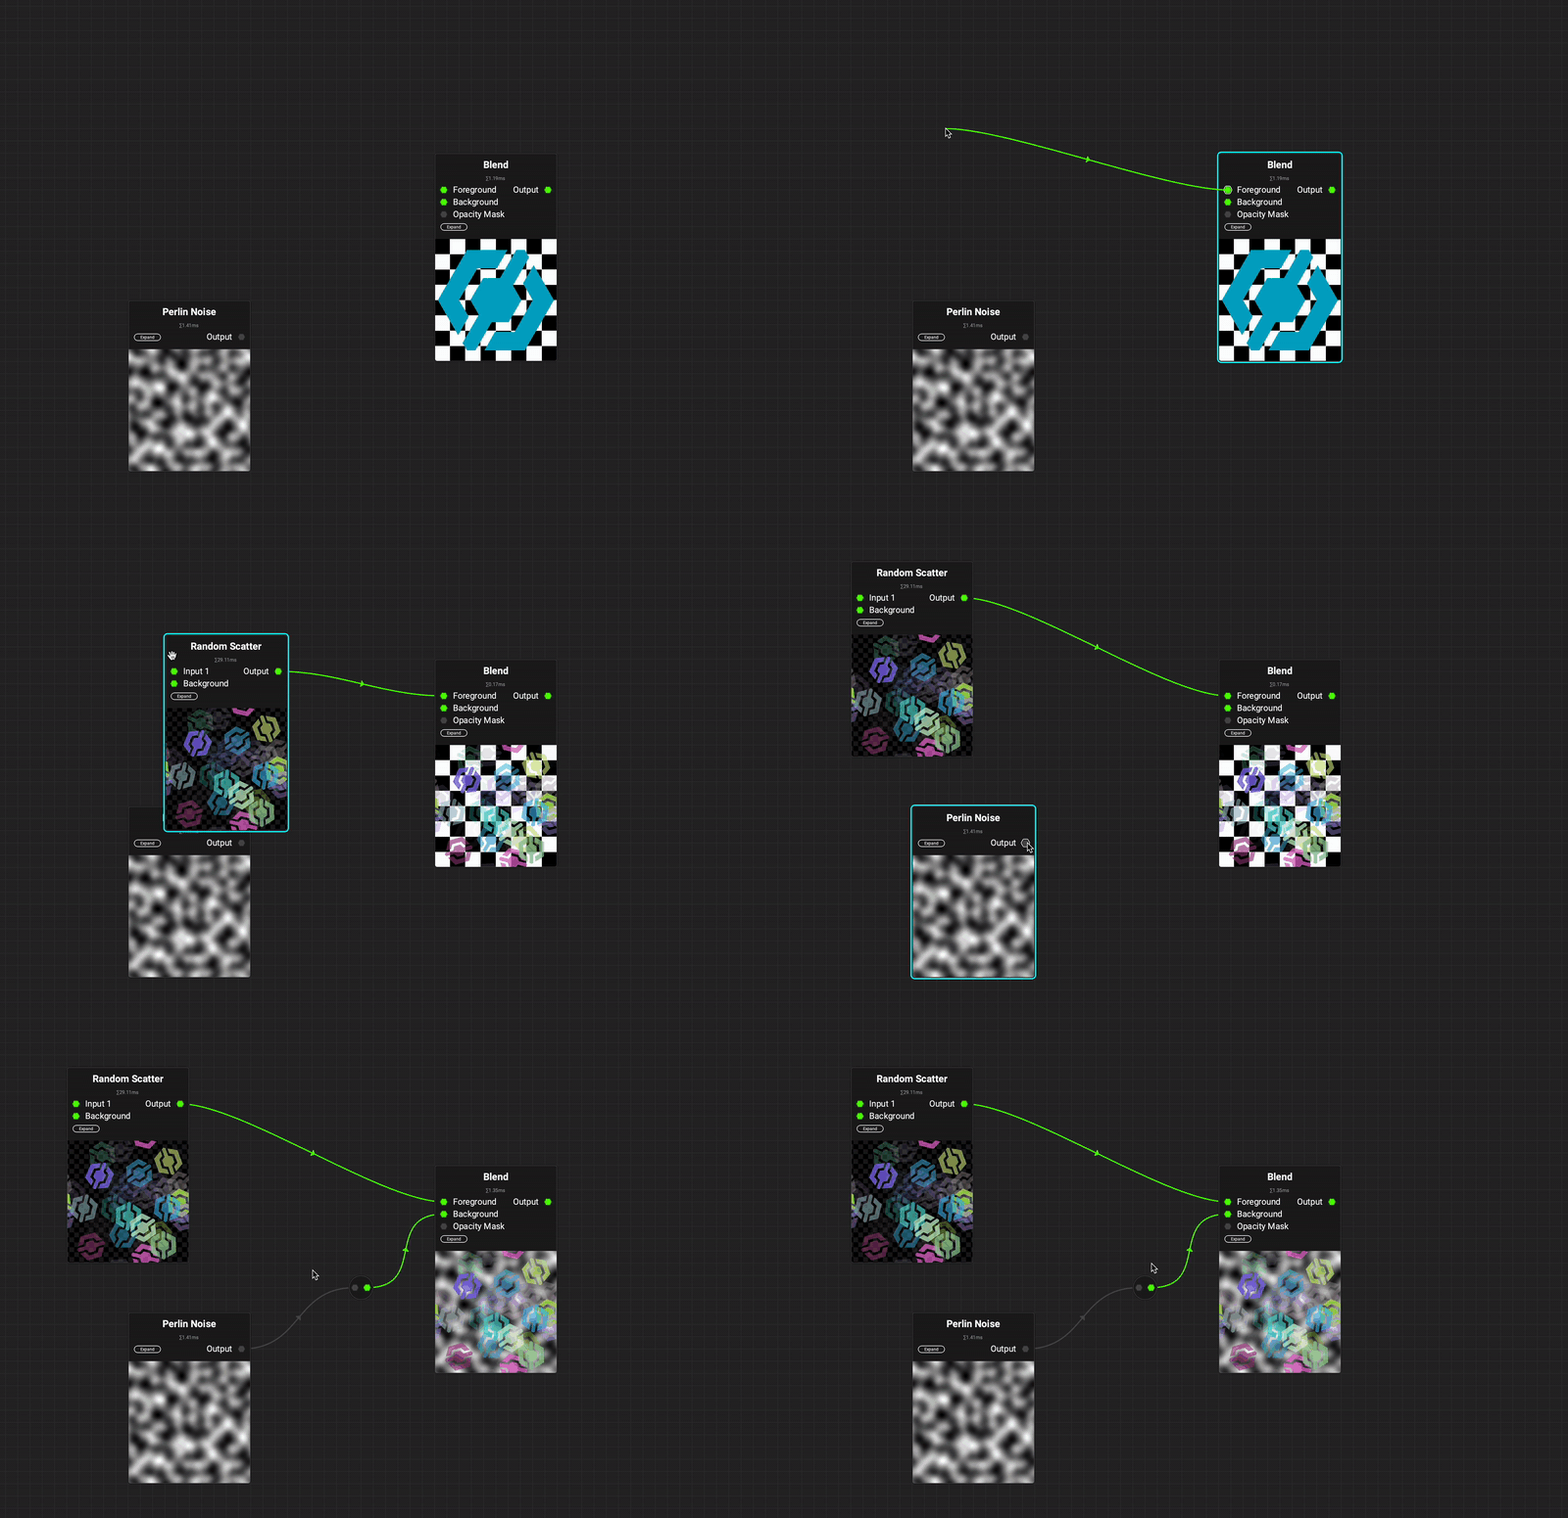
Nodes in InstaMAT can choose to output either grayscale or color information. When adding a node with Quick Search, the compatible permutation will automatically be enabled. When connecting a node already in the
Canvaswith the opposing permutation enabled, a converter node will be inserted between the two nodes.For example: spawning a node that outputs grayscale information from a color image input pin will result in a converter node inserting between the two.
¶ Inputs
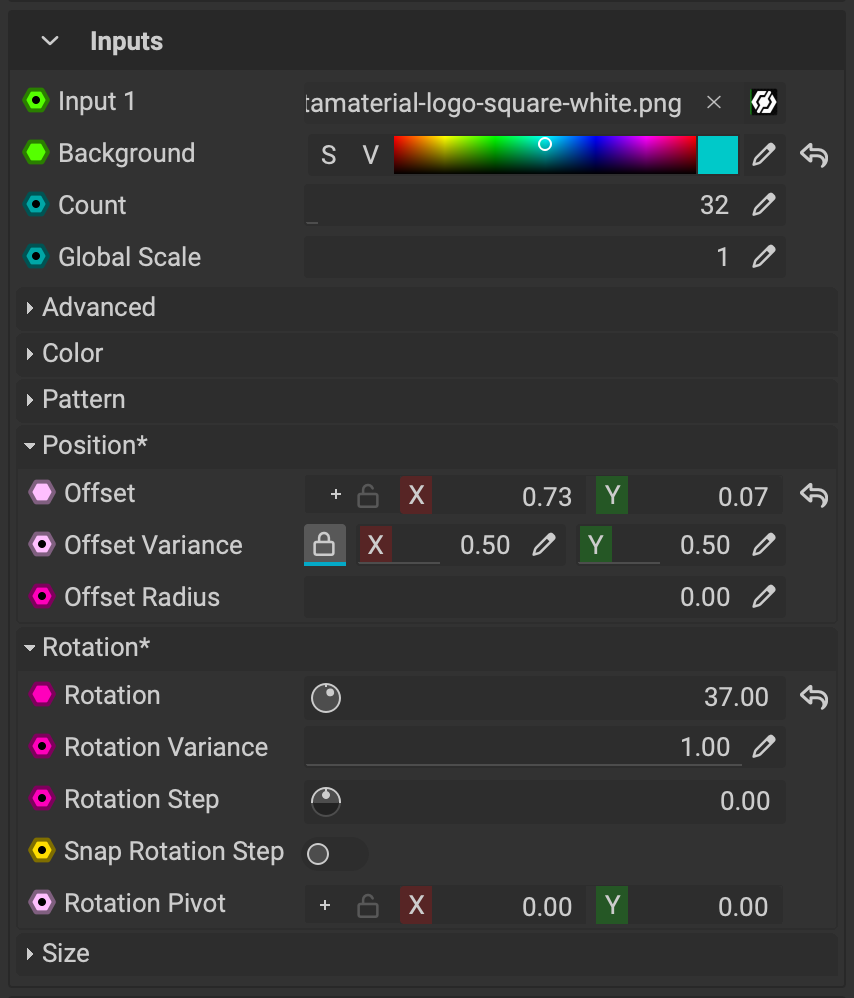 This section displays a node's graph inputs also known as the node's input parameters. Inputs have many different data types and an assortment of widgets to control them. Specific parameter values can be typed in with the keyboard either by double clicking on each parameter or using the icon.
¶ Image and Color Input Widgets
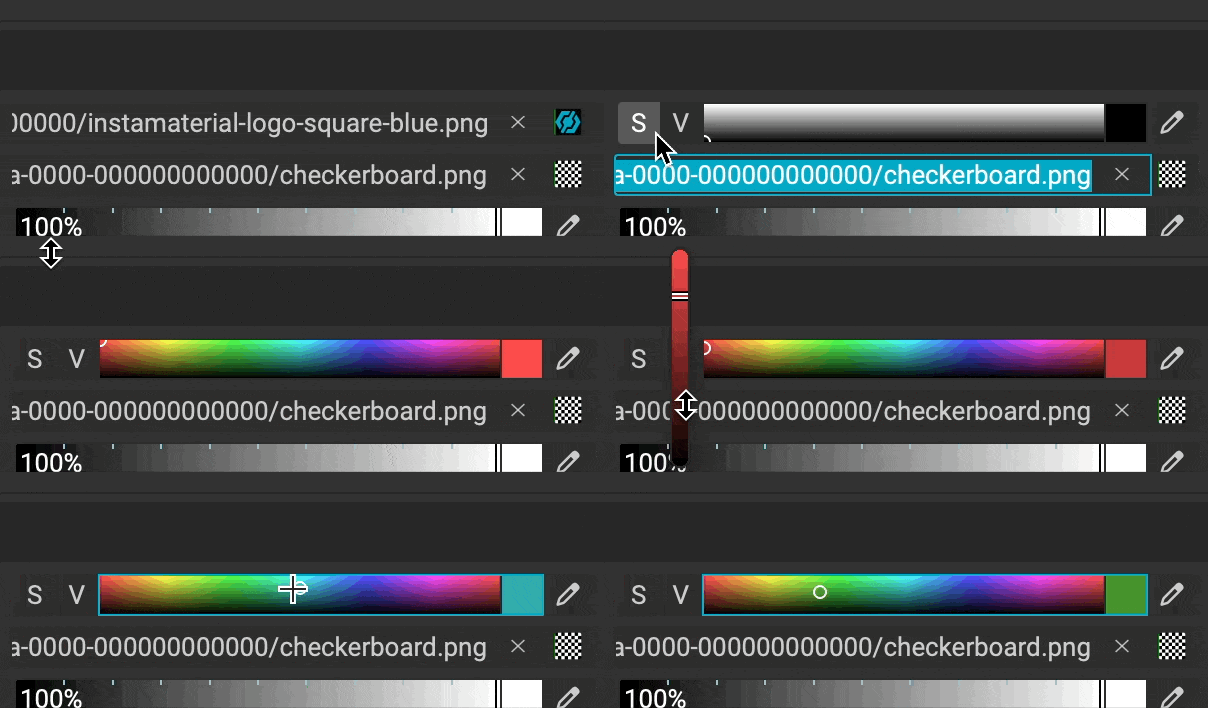 Image inputs in InstaMAT can provide both an image or a solid color. Clicking the icon brings up the Resource Picker panel to input an image. If an image is already utilized, clicking the will clear out the image and allow for a solid color to be chosen.
To quickly adjust the saturation and value of the chosen color, click and drag up or down on the
SandVbuttons to the left of the color well. Scrolling the mouse wheel while the mouse is hovering over these buttons also adjusts their values in increments.
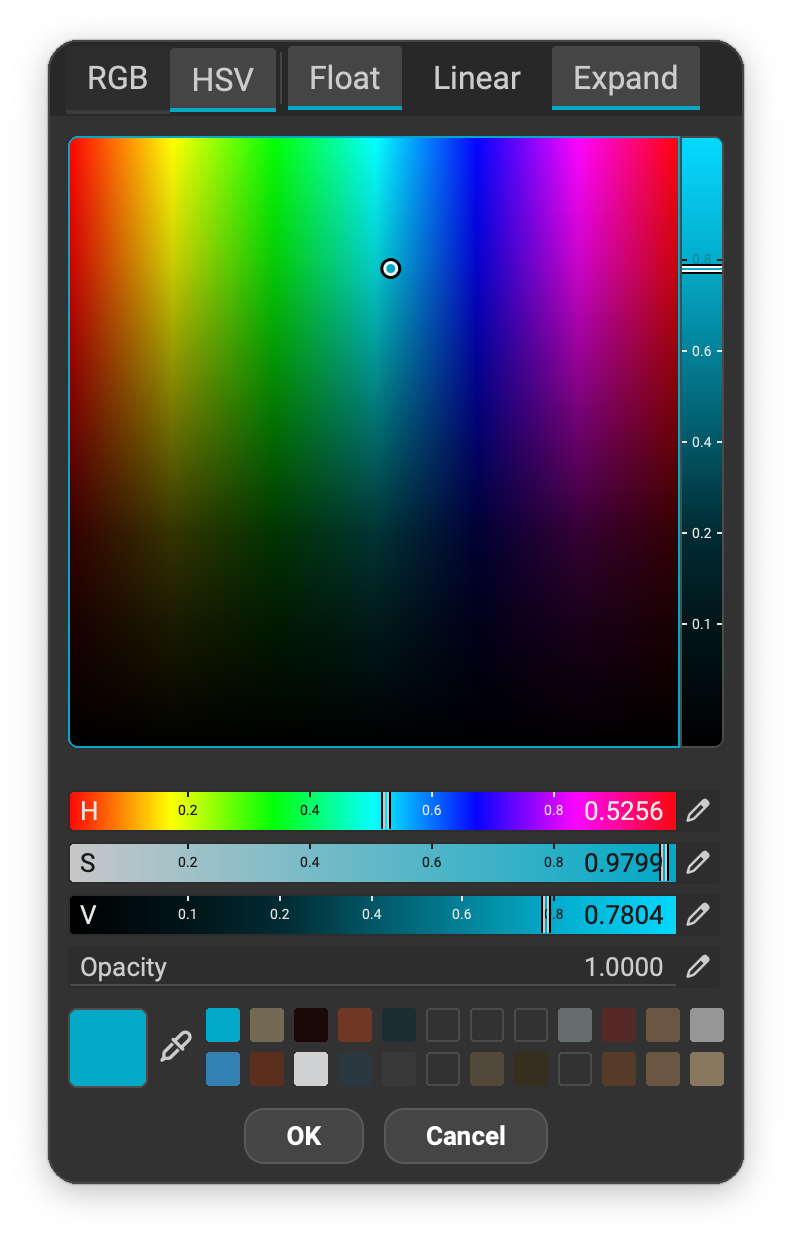 A dedicated color picker panel can be invoked by clicking on the square that represents the chosen color. Additionaly, the color picker can be invoked by right clicking on the widget. This color panel provides access to multuple color input formats such as RGB and HSV. If desired, the HSV ranges can be expanded. An eye dropper is available to pick colors on the screen and color swatches can be saved by dragging the selected color into one of the provided color wells.
¶ Overriding Input Parameters
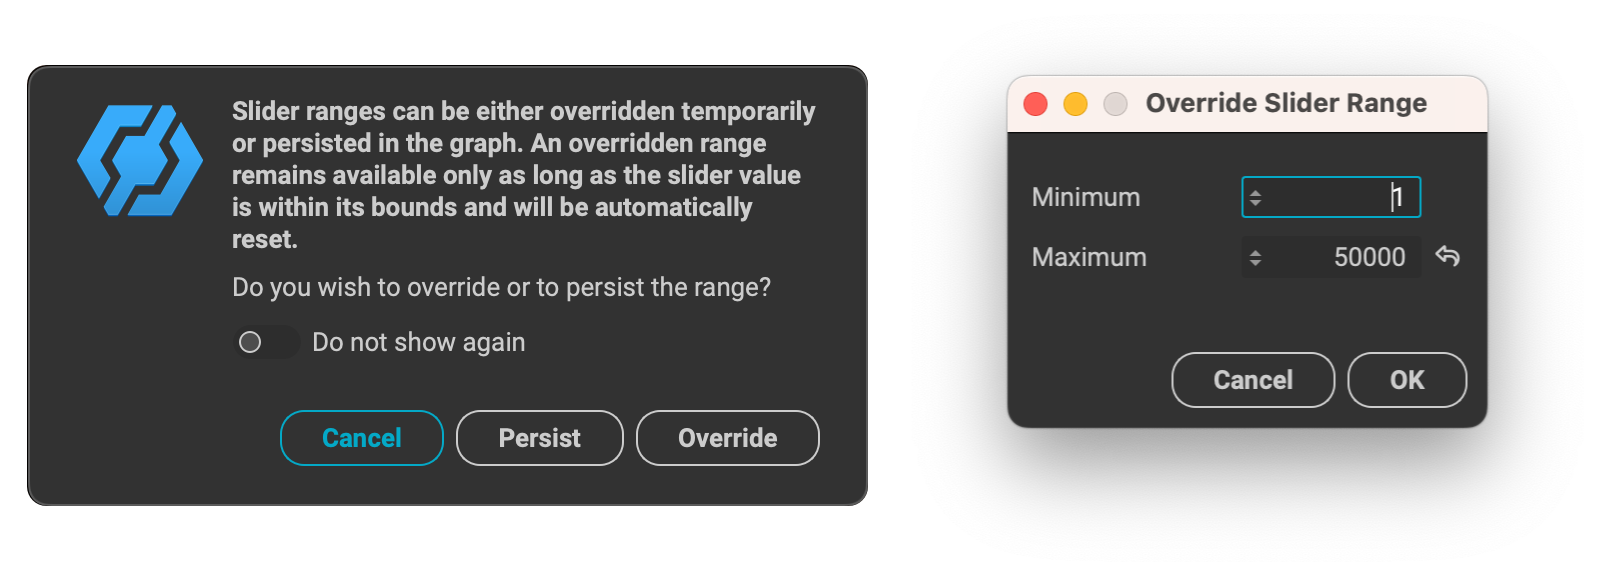
If the UI widget such as a slider does not reach the minimum or maximum value you require, the parameter can be overridden. There are two ways to override the value range of a parameter:
- Right click it to bring up the contextual menu, then choose
Override Slider Range. A dialog will appear whith fields to input the new minimum and maximum values. - Type in a value that is above or below the range. A popup will appear by default notifying that the value excedes the bounds of the range.
¶ Formulas in Fields
Mathematical formulas can be entered into input fields to perform quick calculations. To enter a formula, begin by typing "=" followed by the mathetmatical expression. For example: =5*3
This will input the result of "15" into the input field. Additionally, equasions like sin(1.6) and the use of parenthesis are also possible.

Formula Examples:
=5*3=PI=(5*2)-5
¶ Contextual Menu
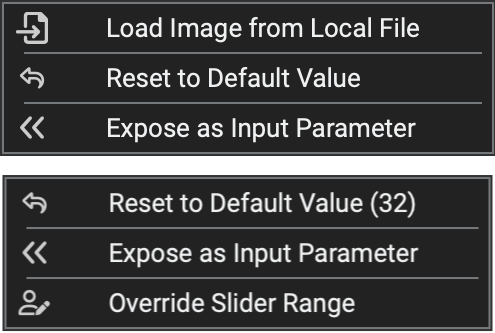 Right clicking on a graph input brings up a contextual menu. The listed items will vary depending on the type of input clicked. The menu contains the following possible options:
- Load Image from Local File: If the graph input is an ElementImage or ElementImageGray type, a local file from the user's machine can quickly be imported and assigned.
- Reset to Default Value: Resets the graph input to the default value.
- Expose as Input Parameter: Exposes the parameter as a graph input for the parent graph.
- Override: Overrides the default minimum and maximum values for the parameter.
¶ Outputs
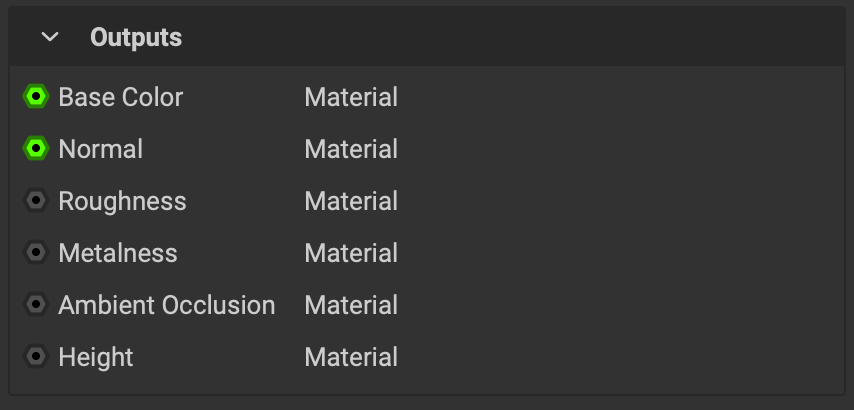 This section displays a node's graph outputs and the category assigned to each output.
¶ Contextual Menu
 Right clicking on a graph output brings up a contextual menu with the following options:
- View Image: If the graph output is an ElementImage or ElementImageGray type, the image is loaded into the Image Viewer.
- View Image in New Tab: If the graph output is an ElementImage or ElementImageGray type, the image is loaded into the Image Viewer in a new tab.
- Expose as Output Parameter: Exposes the node's output as a graph output for the parent graph.
¶ Graph
When a graph is selected, the Graph Object Editor displays the following information. To view information on a graph left click on an empty space in the Canvas.
¶ Information
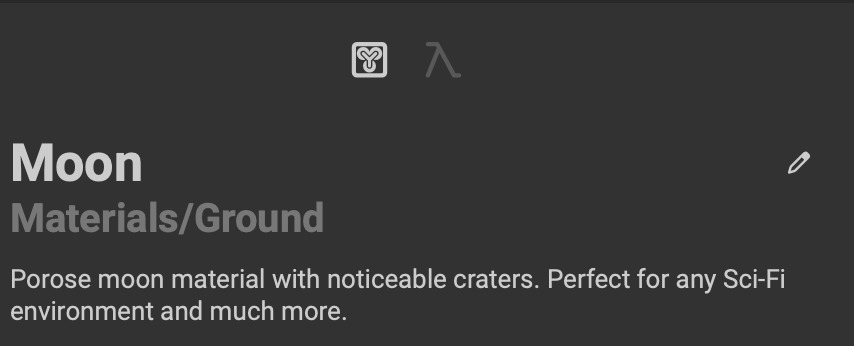 This section displays common graph information.
The following graph attributes are listed:
- Name
- Category
- Description
Use the icon to set the graph's name or double click on any of the information to begin editing. Adjusting the category of the graph will determine where it appears in the MAT Library.
¶ Inputs
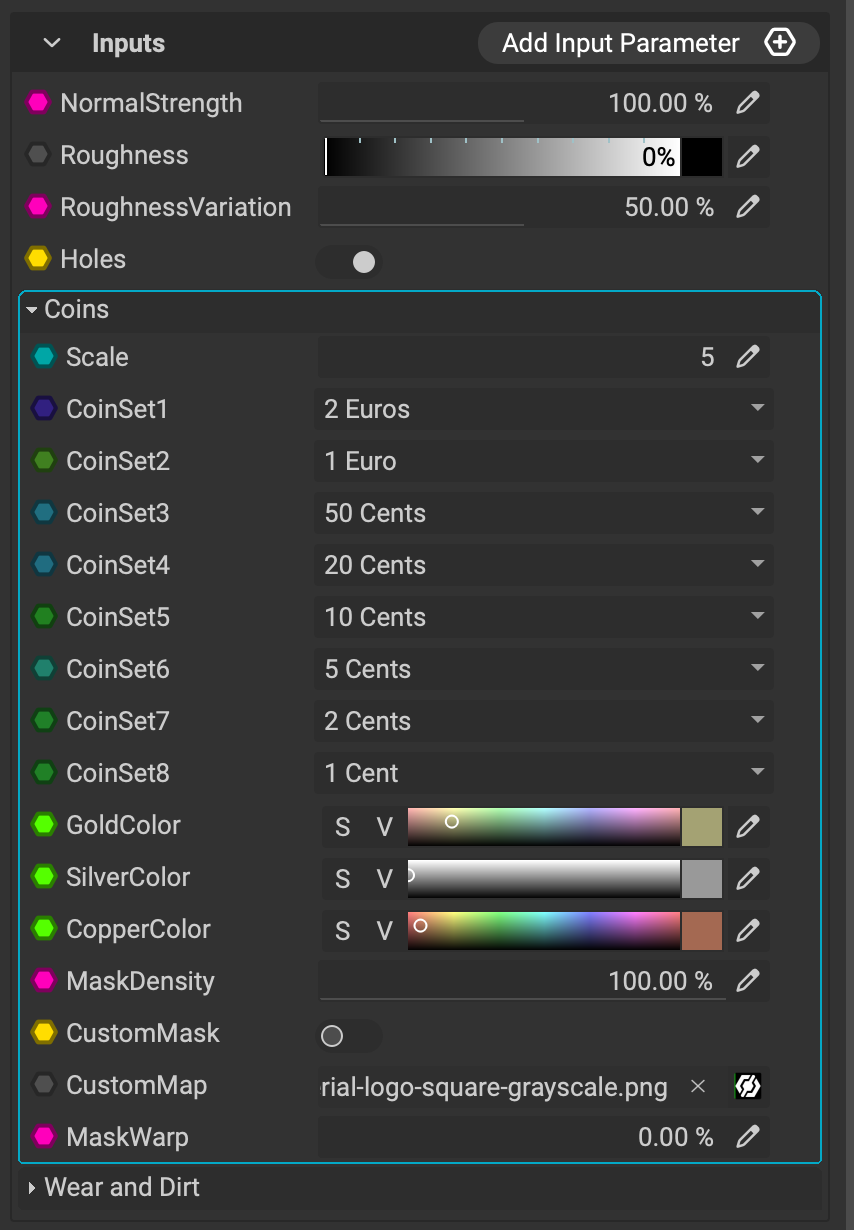 This section manages the creation and manipulation of a graph's graph inputs also known as input parameters or exposed parameters. These inputs are public and can be adjusted from within InstaMAT Studio, InstaMAT Pipeline, and through our integrations.
There are two ways to create input parameters from the Graph Object Editor:
Button
- Click the button in the top right corner of this section.
- Choose the data type for the new input.
- Double click the name of the parameter to rename it.
Contextual Menu
- Click on the node in the
Canvasthat has the parameter you would like to expose. - In the
Graph Object Editor, right click the parameter to bring up the contextual menu. - Choose
Expose as Input Parameter.
The parameter's value set in this section will be its default value when the graph is instantiated. Parameters can be re-arranged by dragging and dropping them into the desired order. To customize them further, use the Graph Variable Editor to do things like organizing them into categories, setting the minimum and maximum ranges, changing the graphical UI widget best used to manipulate the data, and more.
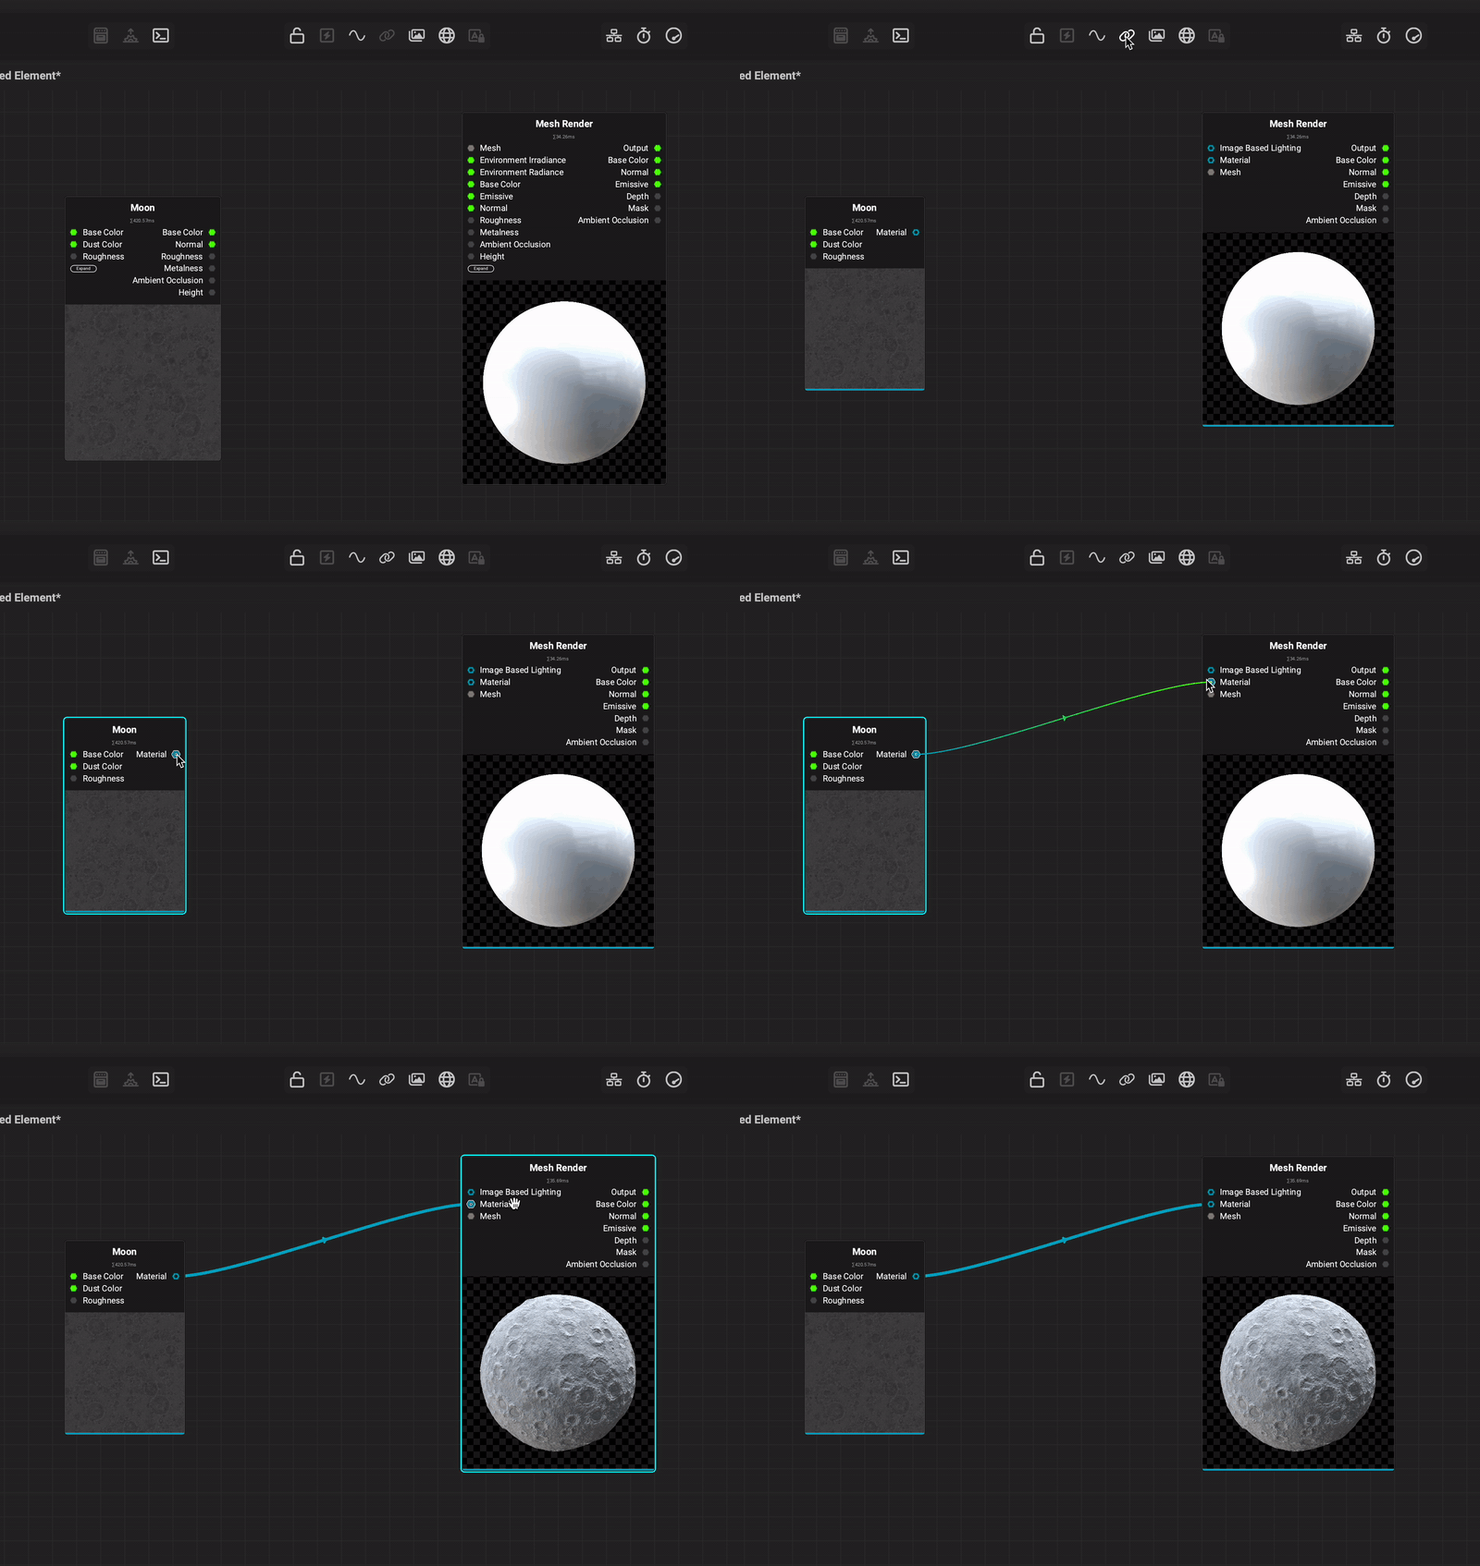
To work with a parameter in the Canvas, drag and drop it directly into the Canvas view where it will become a node. It can then either be connected to a matching input type, or converted using one of the many conversion nodes built into InstaMAT Studio's node library. Conversion nodes can easily be created using Quick Search.
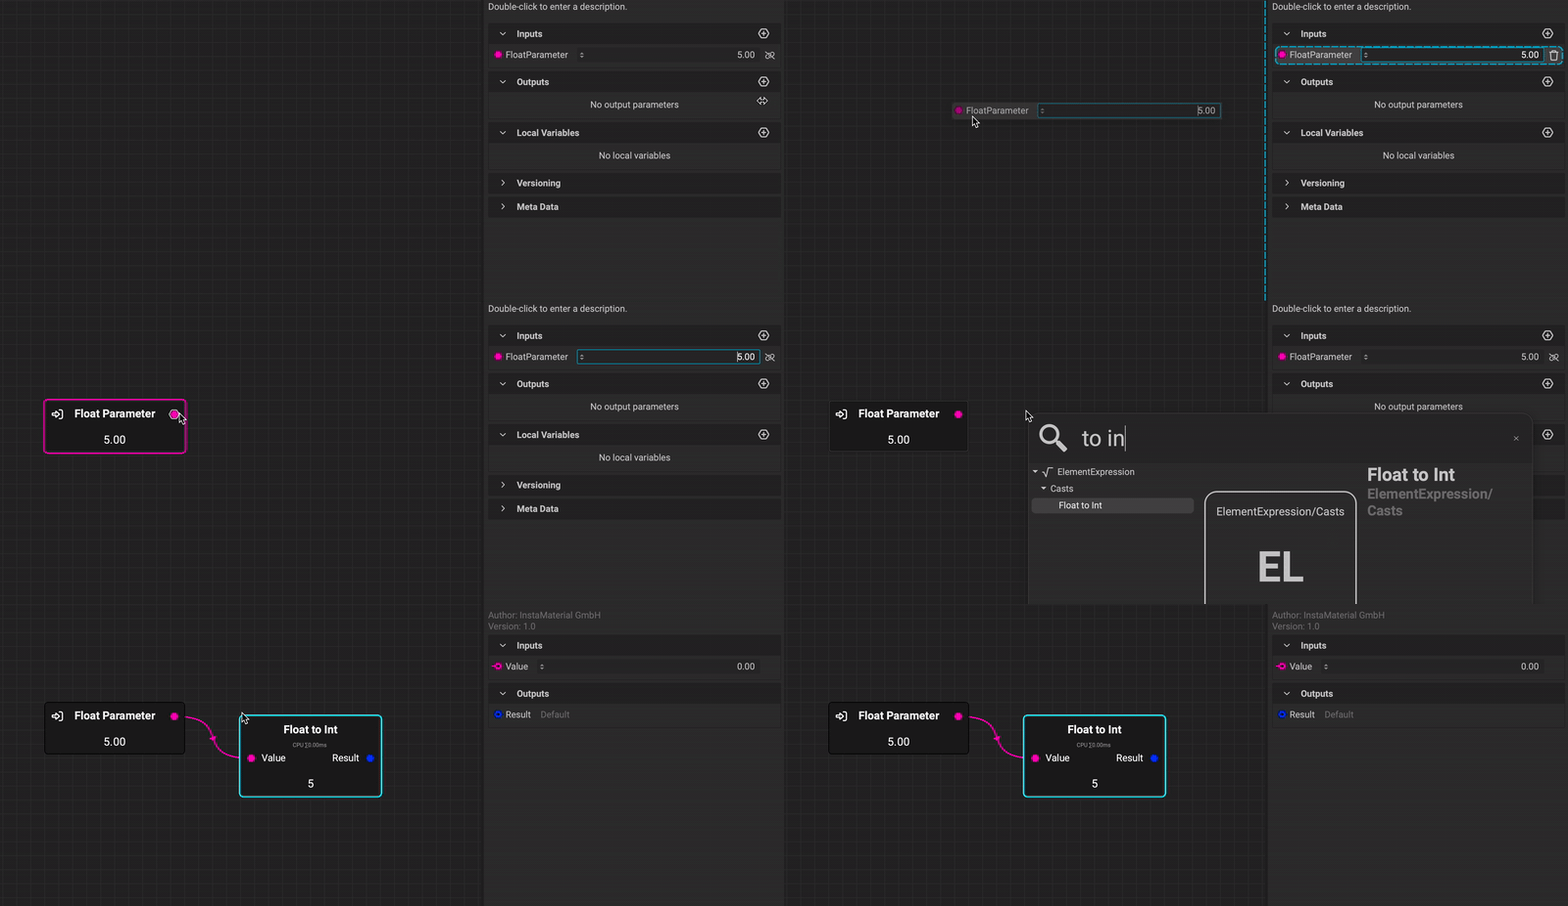
Graph inputs can also be created with
Quick Search. To learn more about how to create graph inputs withQuick Search, please read our dedicated article here.
To learn more about how nodes use inputs and outputs to pass along data, please read our dedicated article: Node-Based Workflow Key Concepts.
¶ Contextual Menu
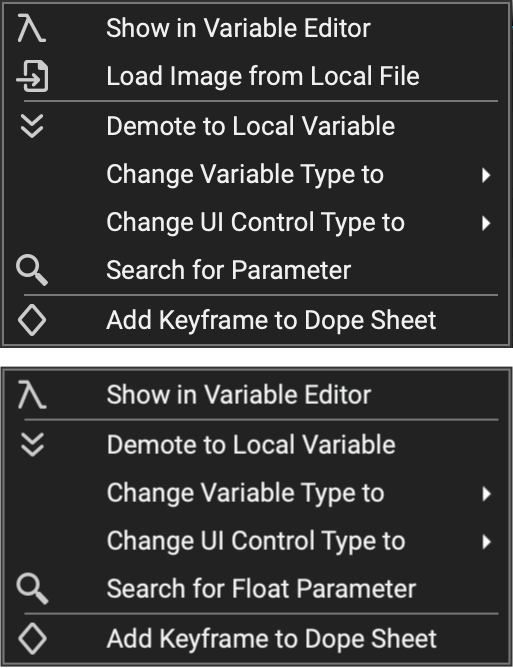 Right clicking on a graph input brings up a contextual menu with the following options:
- Show in Variable Editor: Shows the currently selected graph inputs in the Graph Variable Editor. Multiple inputs can be selected to assign the same information.
- Load Image from Local File: If the graph input is an ElementImage or ElementImageGray type, a local file from the user's machine can quickly be imported and assigned.
- Demote to Local Variable: Demotes the selected public graph input to a private local variable. Learn more about local variables below.
- Change Variable Type to: Quickly changes the graph input's data type.
- Change UI Control Type to: Quickly changes the graph input's UI control widget.
- Search for: Automatically populates the name of the graph input into the
Canvas'ssearch bar and searches for any instances of it in the graph. - Add Keyframe to Dope Sheet: Creates a keyframe in the
Dope Sheetpanel at the playhead's current frame index.
¶ Outputs
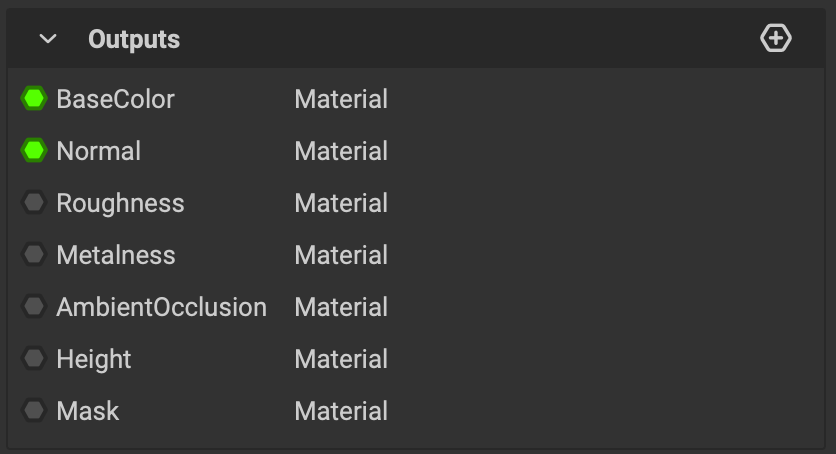 This section manages a graph's graph outputs. When building a procedural PBR material with the Element Graph, these outputs are the maps that generate a material's fundamental channels such as Base Color, Normal, and Roughness.
To create a new graph output:
- Click the button in the top right corner of this section.
- Choose the type for the new output.
- Double click the name of the output to rename it.
When giving an ElementImage or ElementImageGray graph output a common PBR material map name such as "Base Color", "Roughness", or "Ambient Occlusion", InstaMAT will automatically connect these outputs to the proper channel for viewing in the Viewport.
Outputs that export image, mesh, or point cloud data will be utilized in the Image and Data Output Export panel.
A Note about Categories and Link Category Mode
Graph inputs and outputs can be assigned a category in the Graph Variable Editor. If multiple graph inputs and outputs share the same category, they can be combined and connected together with a special connection mode called "Link Category Mode". This mode visually combines connections that share the same category making it easy to connect multiple pieces of information together. Once combined, a single connection can be dragged from the outputs of one node to the inputs of a corresponding node that shares the same category.
¶ Contextual Menu
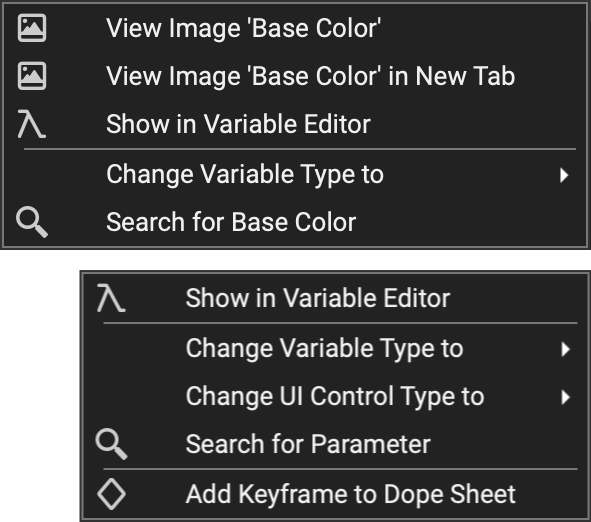 Right clicking on a graph output brings up a contextual menu with the following options:
- View Image: If the graph output is an ElementImage or ElementImageGray type, the image is loaded into the Image Viewer.
- View Image in New Tab: If the graph output is an ElementImage or ElementImageGray type, the image is loaded into the Image Viewer in a new tab.
- Show in Variable Editor: Shows the currently selected graph outputs in the Graph Variable Editor. Multiple outputs can be selected to assign the same information.
- Change Variable Type to: Quickly changes the graph output's data type.
- Change UI Control Type to: Quickly changes the graph output's UI control widget.
- Search for: Automatically populates the name of the graph output into the
Canvas's search bar and searches for any instances of it in the graph. - Add Keyframe to Dope Sheet: Creates a keyframe in the
Dope Sheetpanel at the playhead's current frame index.
¶ Local Variables
 This section displays a graph's local variables. Local variables are private and can only be accessed within the graph itself. These variables are useful when multiple parts of a graph need to privately share the same source of information.
To create a new local variable:
- Click the button in the top right corner of this section.
- Choose the type for the new local variable.
- Double click the name of the output to rename it.
Multiple instances of the same variable can be dragged into a graph regardless if it's a public graph input or private local variable. Each instance will update if the variable's value changes.
¶ Contextual Menu
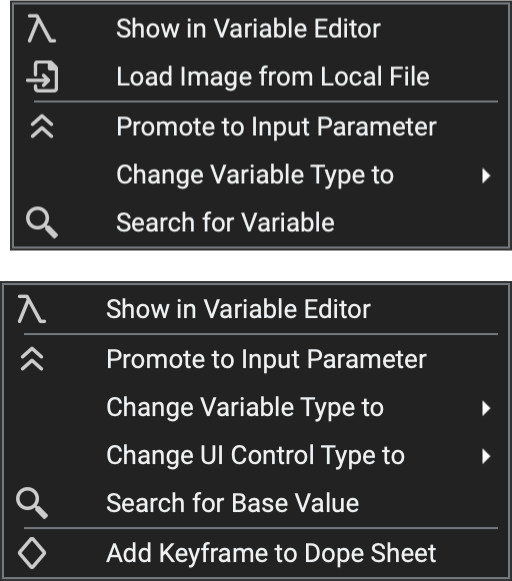 Right clicking on a local variable brings up a contextual menu with the following options:
- Show in Variable Editor: Shows the currently selected local variable in the Graph Variable Editor. Multiple inputs can be selected to assign the same information.
- Load Image from Local File: If the local variable is an ElementImage or ElementImageGray type, a local file from the user's machine can quickly be imported and assigned.
- Promote to Input Parameter: Promotes the selected private local variable to a public graph input.
- Change Variable Type to: Quickly changes the local variable's data type.
- Change UI Control Type to: Quickly changes the local variable's UI control widget.
- Search for: Automatically populates the name of the local variable into the
Canvas'ssearch bar and searches for any instances of it in the graph. - Add Keyframe to Dope Sheet: Creates a keyframe in the
Dope Sheetpanel at the playhead's current frame index.
¶ Versioning
Information coming soon.
¶ Meta Data
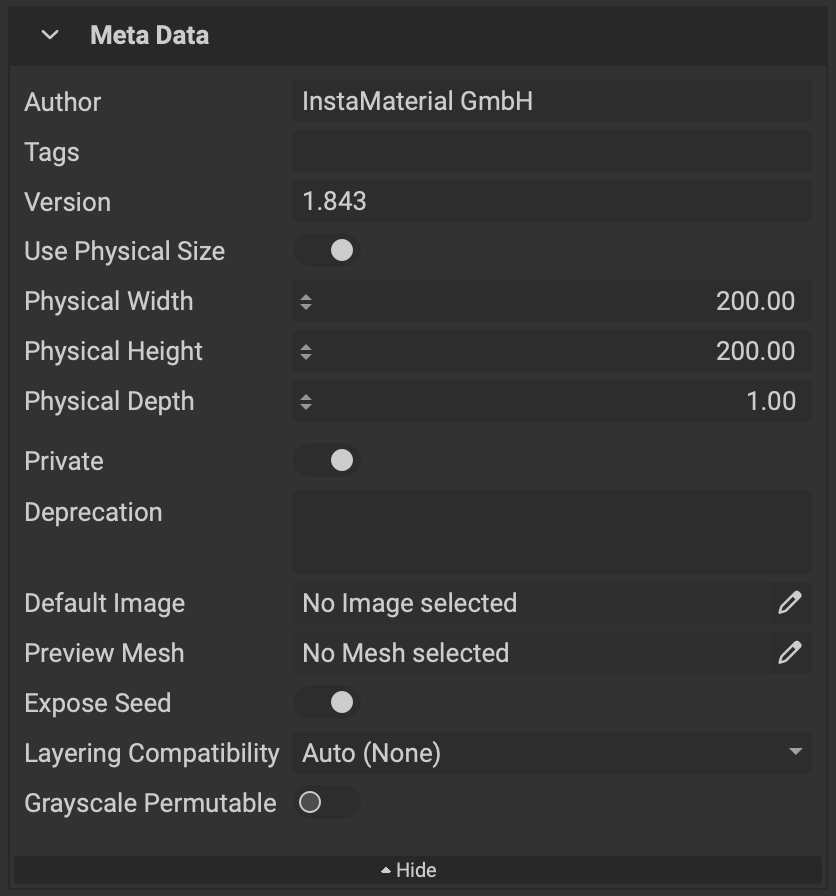 This section allows the user to input attributes for the graph that are used across various parts of InstaMAT.
- Author: Sets the author of the graph.
- Tags: Assigns various tags to the graph. These tags are searchable throughout InstaMAT Studio.
- Version: Sets the graph's version number.
- Use Physical Size: When enabled, the entered physical size in centimeters is assigned to the graph.
- Private: When enabled, private graphs are not displayed in the MAT Library. This is useful when building out a project into subgraphs or "helper graphs" that should be concealed from the library.
- Deprecation: Sets the message to display when the graph is deprecated. All graphs that instance this graph will display this deprecation message when the graph loaded.
- Default Image: Sets the default image for the graph's image parameters.
- Preview Mesh: Assigns a mesh used when previewing the graph outputs in 3D.
- Expose Seed: When enabled, exposes the graph's seed so the user can configure the randomization from the outside.
- Layering Compatibility: Determines if and how the graph can be used with layering projects. Setting the compatibility to
Autoallows InstaMAT to choose the right compatibility based on the graph's category and parameter configuration. - Grayscale Permutable: When enabled, allows the graph to automatically change between outputting grayscale and color information.
Grayscale permutable Atoms and Elements can automatically change their color inputs to grayscale inputs. Most of the heavy lifting is done by InstaMAT and most Atoms will just work. However, conditional behavior can be implemented by branching on the "is Grayscale Permutation" value.
