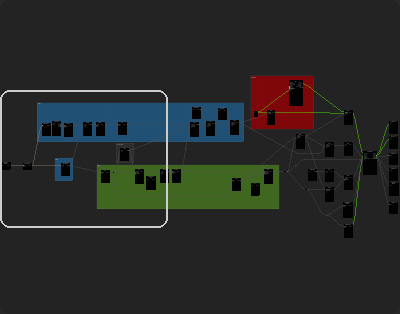
The Minimap is a small representation of the Canvas used to quickly navigate and visualize the nodes in the graph. The highlighted square shows the visible portion of the Canvas and adjusts based on the current zoom level. Comments in the the Canvas appear with their respective colors making it easy to map out a complex project.
¶ Toggling the Minimap
The Minimap can be toggled on and off with the icon in the Canvas Toolbar or by pressing the shortcut hotkey Alt/Option + M.
¶ Navigation
There are a few ways to navigate the Canvas with the Minimap:
- Left click and drag the highlighted square to pan the
Canvas'sworking area at the current zoom level. - Left click and drag a box over a section of the
Minimapto frame up that area in theCanvas'sbounds
At any time, use the F key to focus the
Canvasso that the entire graph fits the working area.
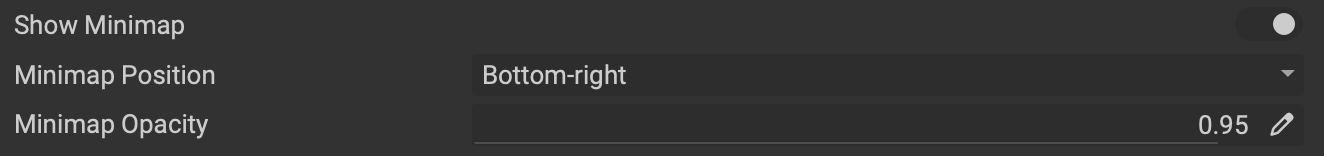
¶ Minimap Settings
The Minimap's settings can be found in Preferences under the Canvas tab.
- Show Minimap: Toggles the
Minimap. - Minimap Position: Determines the location corner of the Minimap in the
CanvasUI. - Minimap Opacity: Sets the opacity of the
Minimap.